Free
Control Room
A working product back-office in one offline file, built like an analogue control room: amber readouts, needle gauges, toggle switches.
Install
Install the "Control Room" skill into ~/.claude/skills/control-room.
Download each file and save it under that folder:
https://skilllift.pages.dev/packs/control-room/SKILL.md → SKILL.md
https://skilllift.pages.dev/packs/control-room/references/style.md → references/style.md
https://skilllift.pages.dev/packs/control-room/references/data.md → references/data.md
https://skilllift.pages.dev/packs/control-room/assets/template.html → assets/template.html
https://skilllift.pages.dev/packs/control-room/assets/ui.en.json → assets/ui.en.json
https://skilllift.pages.dev/packs/control-room/assets/ui.zh.json → assets/ui.zh.json
https://skilllift.pages.dev/packs/control-room/scripts/check.mjs → scripts/check.mjs
https://skilllift.pages.dev/packs/control-room/scripts/set-data.mjs → scripts/set-data.mjs
https://skilllift.pages.dev/packs/control-room/scripts/drive.mjs → scripts/drive.mjs
Then read SKILL.md, tell me what it does, and remind me to start a new session.
Unpack it into ~/.claude/skills
Same skill, different brief
The left is the preview. The right was made by a separate agent from a different brief, using only the installed skill and without seeing the preview.
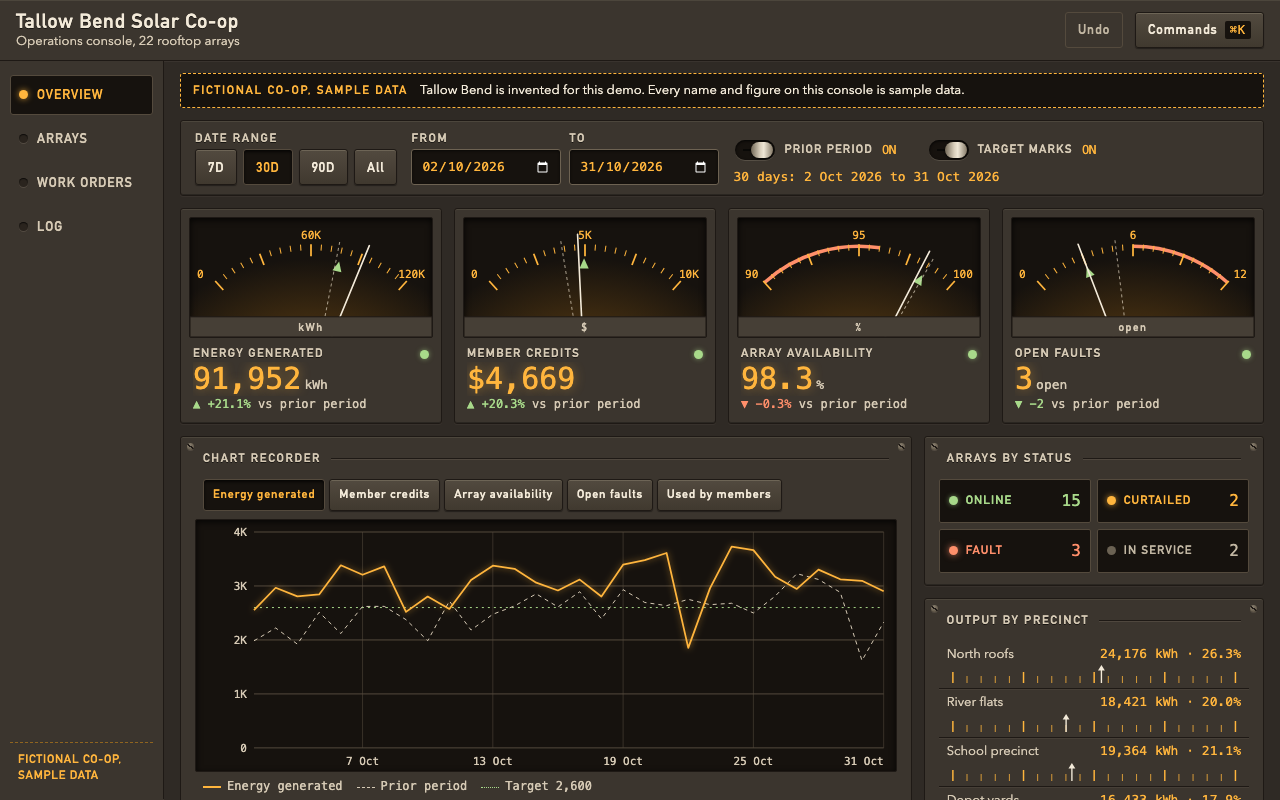
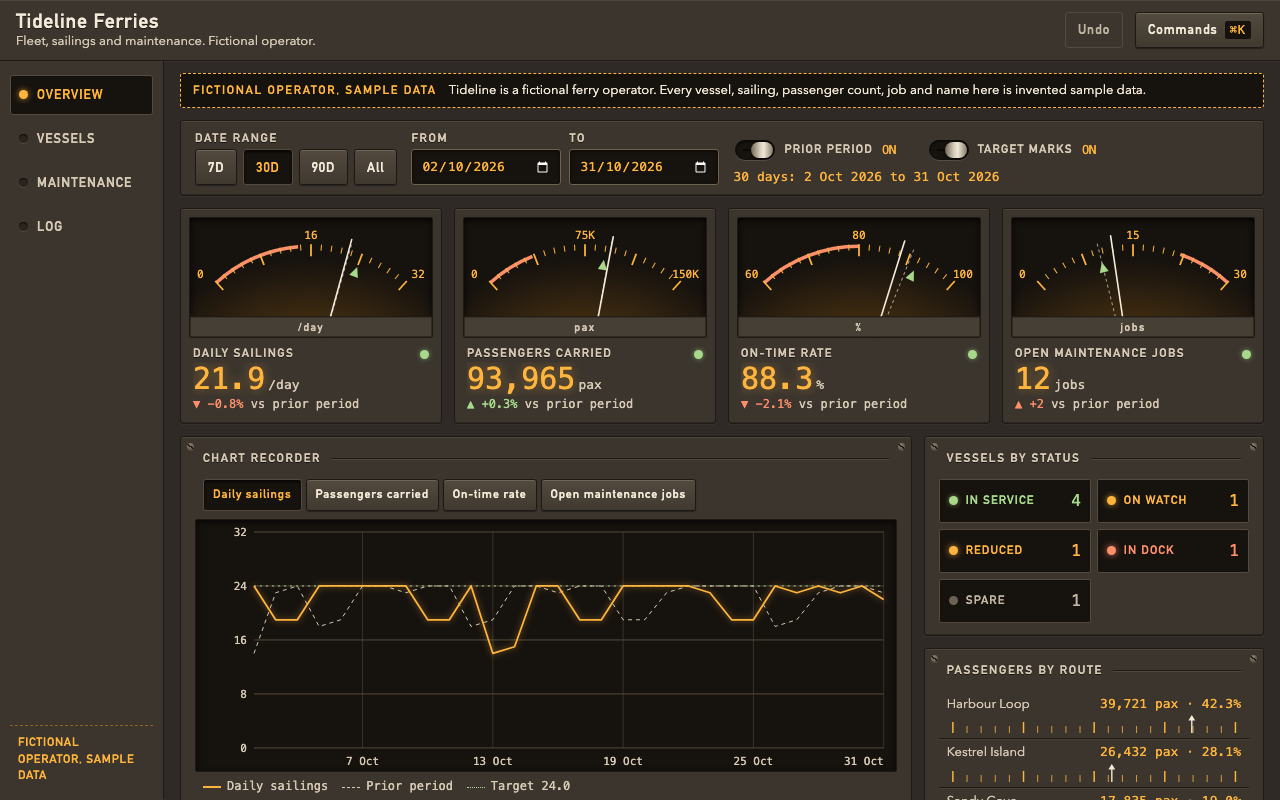
One test run on a fictional brief. Letterforms can differ on systems without the same fonts.
Builds a believable, fully working product back-office as one offline HTML file, styled as an analogue control room with amber readouts, SVG needle gauges and toggle switches. It has a command palette, a date range that recalculates KPIs and charts, a sortable and filterable table, bulk actions with undo, a detail drawer and a drag-and-drop board. Use when someone needs an admin panel, operations console or dashboard for a demo, pitch, spec or prototype, or asks for this style by name.
What it must pass before delivery
check.mjspasses on the final file.drive.mjspasses, and each SKIP it printed is explained in my handover.- I looked at every saved view, drawers and log included, at desktop width and at 375 wide.
- Sample or fictional data says so on every view and in both drawers, with
dataStatusset correctly. - Every KPI that counts cards or rows uses
live, and meter amounts read with the right unit. - No invented figure or person is presented as real.
- One language throughout, including units and status names.
- Gauge scales fit the data: needles sit away from both ends at the default range.
- Default range shows a meaningful comparison, with enough history before it.
Read the full SKILL.md
---
name: control-room
description: Builds a believable, fully working product back-office as one offline HTML file, styled as an analogue control room with amber readouts, SVG needle gauges and toggle switches. It has a command palette, a date range that recalculates KPIs and charts, a sortable and filterable table, bulk actions with undo, a detail drawer and a drag-and-drop board. Use when someone needs an admin panel, operations console or dashboard for a demo, pitch, spec or prototype, or asks for this style by name.
version: 1.0.0
---

# Control Room

The look and all the behaviour live in `assets/template.html`. Your job is to write one JSON file. You never rewrite the CSS or the engine, and `scripts/check.mjs` enforces that.

Exact tokens are in `references/style.md`. Every data field and limit is in `references/data.md`. Read that one before you write data.

In the commands below, `$SKILL` is the folder holding this file. Run them from your own project folder, and keep `data.json`, the output and `shots/` there. Never write into the skill folder.

## Inputs to ask for

Ask once, in one message, for anything the brief does not give.

Required:
1. The product or organisation name, and what the console runs.
2. Up to four headline numbers, with units, and how each adds up over time: total, average or latest value.
3. The main list of things being managed, such as members, orders or sites, with its columns and statuses.
4. The workflow stages for the board.
5. Real data or sample data. If real: the file, and where it came from.

Optional:
6. Daily history, targets and alarm limits.
7. A breakdown for the meters, such as output by region.
8. Language: English or Chinese. One language per version.

## Steps

1. Write `data.json` following `references/data.md`. Set `meta.dataStatus` honestly.
2. Build: `node $SKILL/scripts/set-data.mjs $SKILL/assets/template.html data.json console.html`. Interface strings are added from `assets/ui.en.json` or `assets/ui.zh.json`.
3. Check: `node $SKILL/scripts/check.mjs console.html`. Fix what it reports and rerun until it passes.
4. Drive it: `node $SKILL/scripts/drive.mjs console.html shots/`. It runs at desktop, reduced motion and 375 wide with touch: presets, custom and reversed dates, KPIs against its own sums, meter text, switches, palette, sort, text and status filters, Needs attention, bulk actions, all three undos, drawer edits, the sample label, mouse and touch drag, arrow buttons, Alt with arrows, live KPIs, log, help and export. It prints SKIP for anything your data cannot exercise. It does not cover real phones, Safari, Firefox or screen readers, so say that in your handover.
5. Open and look at every saved screenshot: overview (at the default range), table, row drawer, card drawer, board and log. On phone, `-full` images hide the fixed bottom bar and toast on purpose, and the others show them in place. Look for clipped readouts, wrapped name plates, gauges pegged at one end, empty charts, amounts with the wrong unit. Scripts cannot judge meaning, so read the numbers. Fix the data or shorten the copy. Do not touch the CSS.
6. Hand over the single HTML file, with the list in Deliverables.

Timing: writing the data takes most of the time. The build and check take under a second, and the drive about 30 seconds.

Playwright is needed only for step 4: `npm install playwright`, then `npx playwright install chromium`. If it is installed elsewhere, set `NODE_PATH` to that `node_modules` folder. The delivered console needs nothing installed.

## Slots

There is one slot that matters: the JSON block marked `data-slot="console-data"`. All text on screen comes from it. `set-data.mjs` also writes the `<title>`, the `lang` attribute and the `<noscript>` text so they stay in step. The name plate, subtitle and data label carry `data-slot` attributes, filled from the block, with limits written in the template and `references/data.md`.

## Fields that are easy to get wrong

Full definitions are in `references/data.md`.

- `meters.unit` names the summed amount, such as `kWh`. Never `%`: the page adds the share itself.
- `metrics[].live` ties a KPI to the board or table. Use it for anything that counts cards or rows, with `agg:"last"` and a last series value equal to the count. Undo restores it.
- `board.columns[].done` marks finished columns. They are exempt from Overdue and from `live` counts. With none set, the last column counts as done.
- `agg:"last"` holds its value on any range ending on the last date, and only the change moves. That is correct.
- `perDay` is for totals over the range. The gauge top rounds up to a clean number, so check needle positions on screen. For a daily rate, use `avg` with a unit such as `/day`.
- `dataStatus`: `fictional` if the organisation is invented, `sample` if only the figures are placeholders, `real` with `dataSource` for true figures.
- The status column must use key `status`. `details` types are `text` or `num`. `mobile:false` moves a column into the drawer at phone width.

## What must work

- Ctrl K or Cmd K opens the command palette: go anywhere, set the range, filter, open any record or card, undo, export.
- The date range recalculates gauges, meters and the recorder, including custom dates and the prior-period comparison.
- The table sorts, filters by text and status, and has a Needs attention switch.
- Bulk select sets status or archives, with Undo on the toast, on the button and on Ctrl or Cmd Z.
- The detail drawer edits status, switches and notes, traps focus, and keeps the sample label in view.
- The board moves cards by mouse drag, touch drag on the grip, arrow buttons and Alt with arrow keys.

## When the situation is not ideal

- **The brief is thin.** Restate the user's facts in your own message first. Never invent customers, revenue, people or credentials and present them as real. Fill the gaps with plainly sample data, set `dataStatus` to `sample` (or `fictional` if the organisation itself is invented), and list every inferred line for the user to confirm.
- **Nobody can answer your questions.** Proceed. Use `sample` or `fictional` as above, and list your assumptions at the top of the handover.
- **The user wants more or less.** Rows, cards, metrics and columns all flex within the limits in `references/data.md`. Fewer than 4 gauges is fine. If they want more than 4, put the rest on the recorder with `gauge:false`. If they want an extra screen, say the template has four views and offer the nearest fit; do not bolt one on.
- **There is no real link.** The console has no outbound links by design, because it runs offline. Put a destination in a row's notes as plain text, and say so.
- **The numbers are real.** Set `dataStatus` to `real` and fill `dataSource`. The sample label then disappears, so be sure before you do it.
- **The user wants changes kept.** Edits last until reload. The Export command downloads the current data; write that back with `set-data.mjs`.

## Deliverables

- One self-contained `.html` file.
- A short note: what is real, what is sample, each inferred line, and anything not tested.

## Before delivering

- [ ] `check.mjs` passes on the final file.
- [ ] `drive.mjs` passes, and each SKIP it printed is explained in my handover.
- [ ] I looked at every saved view, drawers and log included, at desktop width and at 375 wide.
- [ ] Sample or fictional data says so on every view and in both drawers, with `dataStatus` set correctly.
- [ ] Every KPI that counts cards or rows uses `live`, and meter amounts read with the right unit.
- [ ] No invented figure or person is presented as real.
- [ ] One language throughout, including units and status names.
- [ ] Gauge scales fit the data: needles sit away from both ends at the default range.
- [ ] Default range shows a meaningful comparison, with enough history before it.

## When not to use it

- For a production admin panel: there is no login, server, database or saved state.
- For a public marketing page, or for a report meant to be read and printed.
- When the brand requires its own look: this style is locked.
- For data that should not be emailed around, since everything sits readable in one file.

## Requirements

A modern browser. No network, server or build step. Node 18 or later for the scripts. Playwright only for `drive.mjs`.
Used in these workflows
- Prototype an internal tool step 2