Free
Ledger Charts
Paste-ready charts from your real data, drawn like an accountant's ledger, with no library and every figure exact.
Install
Install the "Ledger Charts" skill into ~/.claude/skills/ledger-charts.
Download each file and save it under that folder:
https://skilllift.pages.dev/packs/ledger-charts/SKILL.md → SKILL.md
https://skilllift.pages.dev/packs/ledger-charts/references/style.md → references/style.md
https://skilllift.pages.dev/packs/ledger-charts/assets/tokens.css → assets/tokens.css
https://skilllift.pages.dev/packs/ledger-charts/assets/page.css → assets/page.css
https://skilllift.pages.dev/packs/ledger-charts/assets/ledger-charts.js → assets/ledger-charts.js
https://skilllift.pages.dev/packs/ledger-charts/assets/react/LedgerChart.jsx → assets/react/LedgerChart.jsx
https://skilllift.pages.dev/packs/ledger-charts/assets/vue/LedgerChart.vue → assets/vue/LedgerChart.vue
https://skilllift.pages.dev/packs/ledger-charts/assets/sample-data.json → assets/sample-data.json
https://skilllift.pages.dev/packs/ledger-charts/scripts/check.mjs → scripts/check.mjs
https://skilllift.pages.dev/packs/ledger-charts/scripts/make.mjs → scripts/make.mjs
https://skilllift.pages.dev/packs/ledger-charts/scripts/page.mjs → scripts/page.mjs
https://skilllift.pages.dev/packs/ledger-charts/scripts/lib-build.mjs → scripts/lib-build.mjs
https://skilllift.pages.dev/packs/ledger-charts/scripts/recolour.mjs → scripts/recolour.mjs
https://skilllift.pages.dev/packs/ledger-charts/scripts/stress.mjs → scripts/stress.mjs
https://skilllift.pages.dev/packs/ledger-charts/scripts/drive.mjs → scripts/drive.mjs
https://skilllift.pages.dev/packs/ledger-charts/scripts/paste-test.mjs → scripts/paste-test.mjs
Then read SKILL.md, tell me what it does, and remind me to start a new session.
Unpack it into ~/.claude/skills
Same skill, different brief
The left is the preview. The right was made by a separate agent from a different brief, using only the installed skill and without seeing the preview.
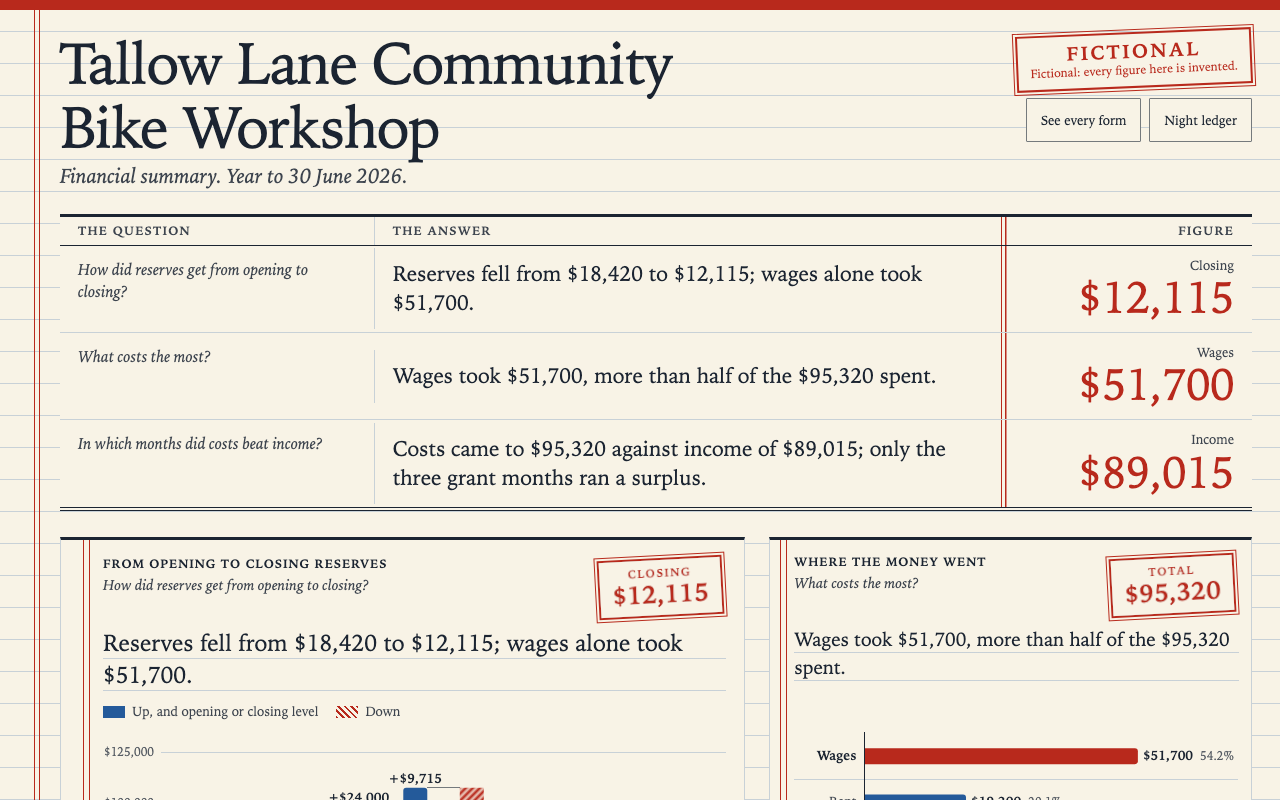
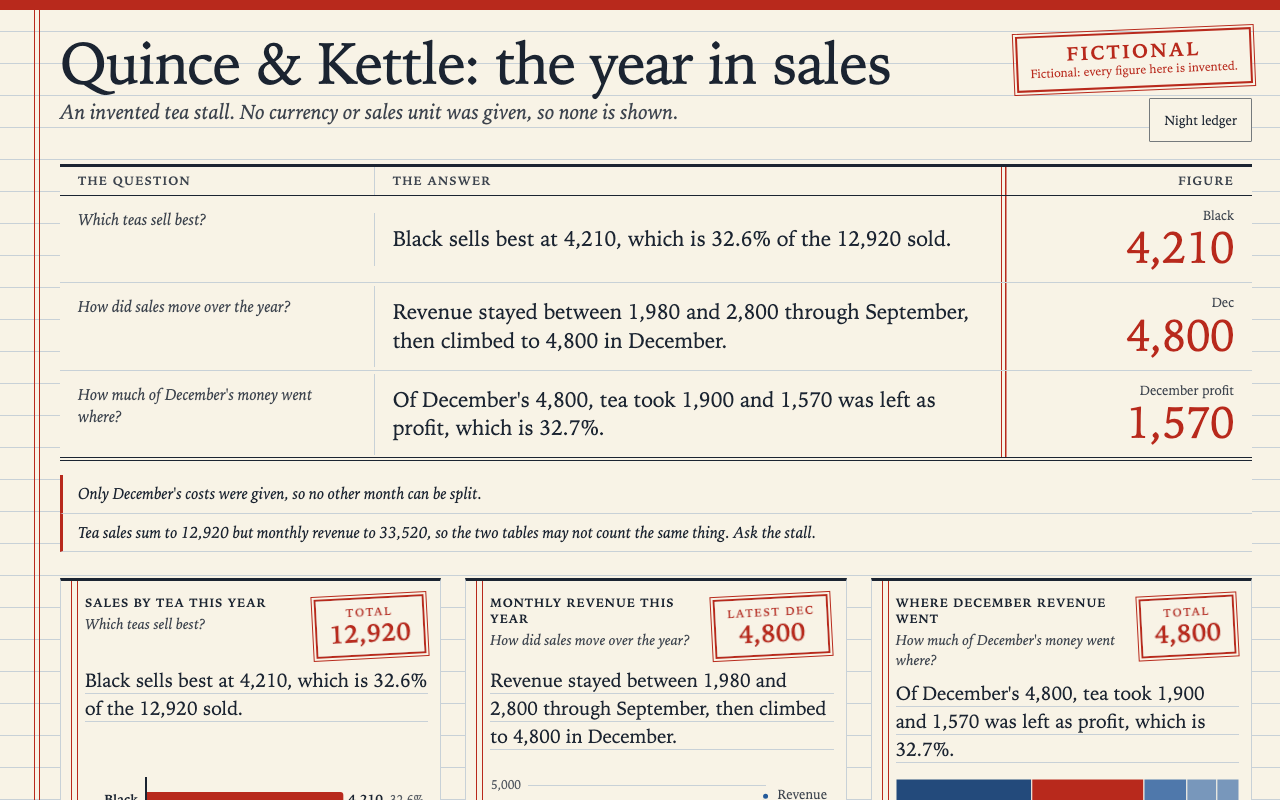
One test run on a fictional brief. Letterforms can differ on systems without the same fonts.
Turns real CSV or JSON data into ready-to-paste data visualisations with no chart library, for plain HTML, React or Vue, in an accountant's-ledger style with a night theme. It first picks the honest form for the question (trend, comparison, part-to-whole, distribution, flow or funnel, calendar activity, or a detailed table) and says why. Every chart has exact computed values, keyboard access, hover details and a screen-reader data table. Use when someone asks for a chart, graph, dashboard, KPI line, heatmap, funnel, waterfall or data grid they can paste into a page, or asks for this style by name.
What it must pass before delivery
check.mjsprinted OK on the output, with the browser checks run- The form and its reason are stated in one sentence
statement.txtholds one true line- Every chart viewed at 1280, 768 and 390
- Hover, keyboard and "Show the figures" tried by hand
- Inferred lines and assumptions listed
- Sample data labelled fictional, or absent
- Tokens are the only place colour lives
Read the full SKILL.md
---
name: ledger-charts
description: Turns real CSV or JSON data into ready-to-paste data visualisations with no chart library, for plain HTML, React or Vue, in an accountant's-ledger style with a night theme. It first picks the honest form for the question (trend, comparison, part-to-whole, distribution, flow or funnel, calendar activity, or a detailed table) and says why. Every chart has exact computed values, keyboard access, hover details and a screen-reader data table. Use when someone asks for a chart, graph, dashboard, KPI line, heatmap, funnel, waterfall or data grid they can paste into a page, or asks for this style by name.
version: 1.0.0
---

# Ledger Charts

The engine and tokens hold the look. Your job is to supply the real data, the question and the words. You do not draw charts by hand and you do not edit `assets/ledger-charts.js`. `scripts/check.mjs` looks at the rendered result and rejects what a viewer would catch.

Read `references/style.md` for the exact tokens and rules.

## Inputs to ask for

Ask once, in one message, for whatever the brief does not give.

Required:
1. The real data, as a CSV or JSON file or pasted rows.
2. The question the chart must answer, in one sentence.
3. The stack: plain HTML, React or Vue.

Optional: unit, source, decimals, page language, day or night theme, colours.

## Steps

For several questions on one page, go to "A page of answers". For one chart:

1. Save the data to a file. Run:
   `node scripts/make.mjs --data data.csv --question "..." --stack html --out out [--unit "$"] [--source "..."] [--lang en]`
   The question decides the job, and the job decides the form. It prints the job, the form and the reason. Tell the user the reason in one sentence.
2. If the printed job is not what the question asks, pass `--job` with one of the seven values below and say why. If `make.mjs` refuses, use the form it names.
3. Open `out/spec.json`. Set `title`, `names` for raw headings, and write `statement` as described in "Writing the sentence". Rebuild with `node scripts/make.mjs --spec out/spec.json --stack html --out out`. The job and reason are kept in the spec.
4. Run `node scripts/check.mjs out/chart.html`. Fix what it reports and rerun until it prints OK. A page takes a few seconds.
5. Look at it at normal size. Open `usage.html` at 1280, 768 and 390 wide and view every chart. Run `node scripts/drive.mjs out/usage.html --shots shots`, which also proves hover, keyboard and the figures. To prove a paste survives the host's CSS, run `node scripts/paste-test.mjs --chart out/chart.html --out paste`.
6. Deliver the files below. Paste `chart.html` whole.

Install Playwright if `check.mjs` cannot find it: `npm install playwright` then `npx playwright install chromium`, or set `NODE_PATH` to a `node_modules` that has it. Without it the rendered checks did not run; never call the work checked.

## The seven jobs

| `--job` | The question asks | Forms it leads to |
|---|---|---|
| `trend` | how something moved over time | `lines`, `multiples`, `summary` |
| `comparison` | which is most, least, best or larger | `ranked`, `paired`, `slope` |
| `part` | how one whole divides, where the money went | `ranked` with a divided bar, `stacked` |
| `distribution` | how values spread, or whether two measures move together | `histogram`, `scatter` |
| `flow` | how much survives each stage, or what walks to a closing figure | `funnel`, `waterfall` |
| `calendar` | which days were active | `calendar` |
| `table` | which rows, or what the columns total | `records`, `sheet` |

A superlative outranks a time word: "Which month sold the most?" is `comparison`, so its months are ranked. If the words give no job, the data's shape decides, and `why.txt` says so; pass `--job` if that is wrong.

## Writing the sentence

The sentence is the first thing read. Write it to answer the question, in the question's own words:

- Name the thing, use the question's verb, give the exact figure, then the one comparison that matters. "Black sells best at 4,210, which is 32.6% of the 12,920 sold."
- For a trend, say the shape: "Revenue stayed between 1,980 and 2,800 through September, then climbed to 4,800 in December."
- Never write a label and a colon ("First: Black at 4,210"). `check.mjs` refuses that form.
- Up to 160 characters. Every number must be computable from that chart's data; `check.mjs` recomputes them.
- Thin brief: leave `statement` out. The engine writes a correct, plainer sentence. It cannot know your question's verb, so write your own when you can.

## A page of answers

For more than one question, or any page rather than a paste, use the page route. Do not build a page by hand. `node scripts/page.mjs --page page.json --out out`, then `node scripts/check.mjs out/page.html`.

```json
{
  "title": "Quince & Kettle: the year in sales",
  "subtitle": "One line of context",
  "lang": "en",
  "theme": "ledger",
  "fictional": true,
  "dataFile": "data.json",
  "notes": ["Only December's costs were given."],
  "charts": [
    { "question": "Which teas sell best?", "from": "sales_by_tea", "job": "comparison", "x": "tea", "y": "sales",
      "statement": "Black sells best at 4,210, which is 32.6% of the 12,920 sold." }
  ]
}
```

It builds the ruled page with its background and theme, a day and night button, the answers ledger (question, sentence, key figure) at the top, and every sheet, with sheets in a row levelled to the same height. On a phone the ledger fits the first screen, and `check.mjs` measures that.

| Page field | Meaning | Limit | If the brief is thin |
|---|---|---|---|
| `title` | what the page is | 60 | Use the user's name for it. Required. |
| `subtitle` | one line of context | 90 | Leave it out. |
| `theme` | `ledger`, `night` or `auto`; sets the whole page | | Leave it out for day. |
| `fictional` | stamps the page and every sheet | true | Only for invented figures. |
| `notes` | what the reader must not miss: gaps, a mismatch between tables | 160 each; numbers are checked | State real gaps only. |
| `dataFile` | a CSV or JSON file, relative to page.json | | Or give each chart `data`. |
| `charts[].from` | a named table in a JSON `dataFile` | | |
| `charts[].span` | columns of 12 | 4 to 12 | Leave it out: 1 chart is 12, 3 are 4 each, otherwise 6. |
| `charts[].key` | `{ "label", "value" }`, the figure in the ledger | numbers are checked | Leave it out: the engine picks it. |
| `charts[].answer` | `false` keeps a chart out of the ledger | at most 4 in the ledger | Keep supporting sheets out. |

Any chart field below also works on a chart. If the same thing is counted differently in two tables, say so in `notes` and ask the user: do not reconcile it yourself. If a question can only be partly answered, answer that part and say what is missing in `notes` or the chart's `note`.

To theme a page by hand instead: `data-lc-theme` on `<html>`, `class="lc-page"` on `<body>`, inline `tokens.css` and `assets/page.css`, then call `LedgerCharts.alignRows()`.

## Deliverables

- Readable source: `ledger-charts.js`, with no library and no dependency, plus `react/LedgerChart.jsx` or `vue/LedgerChart.vue`.
- A runnable usage example: `usage.html`, `react/Usage.jsx` or `vue/Usage.vue`.
- One tokens file: `tokens.css`.
- `statement.txt`: one line saying what the chart shows.
- `why.txt`: the form chosen and why. Paste-ready block: `chart.html`. For a page: `page.html` and `statements.txt`.

## Choosing the form

| The data is asked to | Form (`kind`) | Holds | When it cannot honestly show the data |
|---|---|---|---|
| Give one current value | `summary` | up to 6 measures | over 6: use `multiples` |
| Show a trend | `lines` | up to 4 series, 500 points and more | over 4 series: use `multiples` |
| Show a trend per group | `multiples` | 2 to 24 panels on one scale | 1 panel: `lines`; over 24: `ranked` |
| Compare two or three measures | `paired` | 2 or 3 measures, up to 24 categories | over 24: `ranked`, over 100: `lines` |
| Compare categories | `ranked` | one measure, up to 100 rows, shares printed; past 40 the tail folds into a labelled Other | over 100: `histogram` |
| Compare two points in time | `slope` | exactly 2 columns, up to 14 items | over 14: `ranked` |
| Show part-to-whole over wholes | `stacked` | 2 to 4 parts, up to 24 columns | over 4 parts: `multiples`; 1 part: `events` |
| Show part-to-whole of one whole | `ranked` with a divided bar | up to 6 parts for the bar; shares printed | no pie, no donut |
| Mark what moved a series | `events` | one measure, up to 60 columns, up to 9 notes | note not in data: fix it; over 60: `lines` |
| Show a distribution of one measure | `histogram` | at least 8 values | under 8: `ranked` |
| Show a relationship of two measures | `scatter` | up to 3,000 points, 3 groups | over 3 groups: `multiples`; over 3,000: `histogram` |
| Show a flow that only narrows | `funnel` | 2 to 8 stages, no negatives; a rising stage is marked | 1 stage: `summary`; over 8: `ranked`; negatives: `waterfall` |
| Show gains and losses to a total | `waterfall` | up to 24 steps, negatives and zero crossings | over 24: `records` |
| Show activity by day | `calendar` | ISO dates, up to 3 years; negatives drawn hollow | no dates: `events`; over 3 years: `lines` |
| Find particular rows | `records` | sort, filter, 25 rows a page | none |
| Read cells and totals | `sheet` | frozen header and totals, up to 2,000 rows | over 2,000: `records` |

Every form handles negative numbers, missing values (a gap and an x, never zero), a single point (with a note saying so), very long labels (wrapped, then cut with the full text in the details and table) and Chinese labels. Huge and tiny values together keep a true scale; values under a pixel leave a tick and a note.

## Fields you may fill

Each goes in `spec.json`. Never invent a value.

| Field | Meaning | Limit | If the brief is thin |
|---|---|---|---|
| `title` | names what is plotted, not the finding | 60 characters | Build it from the question. Required. |
| `question` | what the chart must answer | 90 | Restate the user's words. If nobody can answer, say what you assumed. Required. |
| `statement` | one sentence answering the question | 160; every number must be computable from the data | Leave it out. The engine writes a plainer one from the data. |
| `note` | a remark in the margin of the sheet: what the data cannot answer | 120; numbers are checked | State real gaps only. |
| `highlight` | the row that is the point, drawn in the one red | must match a label | Leave it out: the largest row is red. |
| `whole` | adds the divided bar to a ranked chart; `--job part` sets it | at most 6 positive parts | Let the job set it. |
| `shares` | `false` removes printed shares from ranked rows | | Leave it on. |
| `extremes` | `false` removes the printed low and high from a line | | Leave it on. |
| `unit` | prefix or suffix on values, such as `$` or `%` | 6 | Leave it out. Never guess a currency. |
| `units` | a different unit per column, `{ "visits": "" }` | 6 each | Set `""` for any count beside money. |
| `decimals` | rounds the display; the note says so | whole number | Leave it out: figures stay exact. |
| `source` | where the data came from | 60 | Leave it out. Do not guess. |
| `emptyText` | what the empty state tells the reader | 80 | Only when the emptiness is real, such as "No sales recorded yet." |
| `events` | `[{ "at": "<x value>", "note": "..." }]` | 9 notes, 60 each; `at` must match a row | Leave it out unless the user named the events. |
| `axisFrom` | starts a line or scatter axis above zero; printed as a mark | a number | Leave it out. Bars refuse it. |
| `names` | display name per column | short | Tidy obvious headings; list what you changed. |
| `x`, `y`, `facet`, `label`, `group`, `columns` | column mapping | must exist in the data | `make.mjs` fills these. |
| `total: false` | no sum, for rates and averages | | Set it whenever a sum would mean nothing. Percent units already do this. |
| `lang` | `en` or `zh`; one language per chart | | Match the user's. |
| `theme` | `ledger`, `night` or `auto` | | Leave it out for day. |
| `fictional` | prints a fictional label | true | Only for invented figures. |

## Recolouring

Two to four inputs: `node scripts/recolour.mjs --paper "#fff8ee" --ink "#201a14" [--mark "#..."] [--red "#..."] [--theme night] --out out`, where `out` is the output folder. It measures contrast and refuses a failing set, rewrites `tokens.css`, writes `colours.json`, and re-inlines the colours in every HTML file there. Rebuilds with `make.mjs` or `page.mjs` keep them. Then run `node scripts/check.mjs out/chart.html`: it fails if any output has not got the new colours. Do not put colours anywhere else.

## When things are missing

- Thin brief: restate the user's facts in your reply, list anything you inferred line by line, and invent nothing.
- Nobody can answer: proceed from the data, and list your assumptions: job, column mapping, unit, what you tidied.
- No data: do not make numbers up. Ask for it. To show the look, run `make.mjs --sample`, which labels itself fictional. Real but empty data: pass `--empty-text`.
- Different size: charts fill their container. Set the container's width. Heights are fixed by the form, so they never clip axis labels.
- No real link for the source: leave `source` out rather than citing a link you cannot confirm.
- Unreadable values ("12万", "about 40") become missing and are counted in a note. Convert them first and tell the user.

## Before delivering

- [ ] `check.mjs` printed OK on the output, with the browser checks run
- [ ] The form and its reason are stated in one sentence
- [ ] `statement.txt` holds one true line
- [ ] Every chart viewed at 1280, 768 and 390
- [ ] Hover, keyboard and "Show the figures" tried by hand
- [ ] Inferred lines and assumptions listed
- [ ] Sample data labelled fictional, or absent
- [ ] Tokens are the only place colour lives

## When not to use it

- For maps, network graphs or 3D. It has none.
- For more than 3,000 points or live-streaming data. Use a canvas tool.
- When a single sentence answers the question. Write the sentence.
- When the brand forbids serif ledger styling. Recolouring does not change the character.

## Requirements

Node 18 or newer. A browser from 2023 on (`color-mix`, shadow DOM). No runtime dependency beyond React 18+ or Vue 3 for those stacks. Playwright for the render checks only. `make.mjs` takes under a second.
Used in these workflows
- Raise money or pitch step 3
- Report to a client step 2
- Present research step 2
- Make a report deck step 2
- Prototype an internal tool step 3